


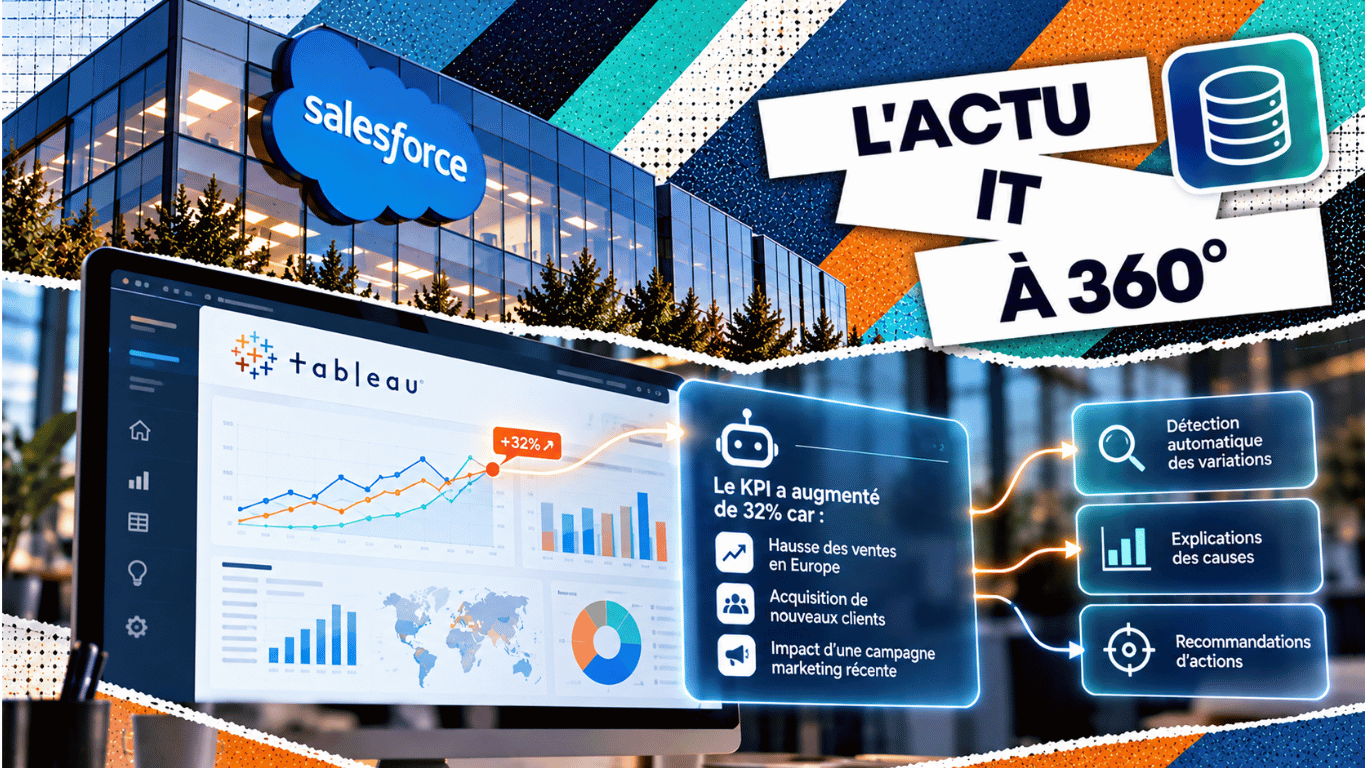
Salesforce has announced a definitive agreement to acquire Loops, an AI-based analytics platform, with the intention of integrating its technology into Tableau after closing.[1] The aim is to monitor metrics and bring out the factors associated with their changes. For businesses, the promise is to spot earlier what deserves analysis, provided they have reliable data and do not mistake a suggested explanation for a proven cause.
A deal announced before an integration that has yet to be built
The transaction is expected to close in early November, during Salesforce’s fiscal year 2027, subject to customary conditions. The press release gives no precise date for when Loops’ capabilities will be available in Tableau.[1] This is therefore an announced product direction, not a new feature already available to all users.
This distinction matters for a team preparing its budget or its analytics architecture. It can follow the project and identify its needs, but it should not base an operational deadline on an integration whose terms have yet to be specified.
Metrics become the starting point for an investigation
According to Salesforce, Loops monitors performance, detects trends and anomalies, and then brings out what contributes to changes. Its functions can be triggered from Slack or by email. The vendor wants to use them to strengthen Tableau’s agentic analytics and the prioritisation of actions.[1]
A key performance indicator, or KPI, summarises one dimension of the business: conversion, processing time or retention, for example. When it changes, the first need is often to work out where to look. Does the change concern all customers, or one particular region, product or channel? Proactive analysis can help organise this search.
Detecting a change is not enough to make a decision
This grid distinguishes three stages of analytical reasoning and the checks they require. It is an editorial reading of the business need.
| Stage | Question to address | Useful check |
|---|---|---|
| Detection | Which metric has changed and over what period? | Check data freshness and the comparison baseline. |
| Explanation | Which segments contribute to the change? | Examine volumes, changes in measurement and other factors. |
| Action | What intervention could improve the result? | Validate the hypothesis and measure the effects before rolling it out. |
A factor associated with a decline is not always its cause
A channel may account for a large share of a drop in sales because its traffic has changed, because a product is unavailable there or because data collection is incomplete. Breaking down a result helps locate the phenomenon; it does not automatically decide between all these explanations.
Before changing a campaign or a process, the analysis must be compared with business events. A controlled comparison or an experiment can then help test a hypothesis. The decision depends as much on this verification as on the clarity of the generated commentary.
Defining KPIs remains essential groundwork
Two departments may use the same word for different measures. A conversion rate calculated per visit does not match a rate calculated per user. Likewise, a cancelled order or a late-arriving event can change the result depending on the rules applied.
Continuous monitoring therefore requires a shared definition: formula, population, period, exclusions and reference source. The history of changes must also be kept. An alert triggered after a formula change does not necessarily describe a real change in activity.
An SME can test the value on a single metric
Take an illustrative scenario: an online shop notices a drop in its conversion rate. The team compares devices, channels and product categories. If the drop is concentrated on mobile, it then checks for payment incidents, stock shortages and recent changes to the customer journey. This scenario is not a customer result published by Salesforce.
The pilot should check that the tool surfaces useful observations without multiplying secondary alerts. The team can measure the time to a confirmed anomaly, the time needed to qualify the explanation and the share of alerts that are genuinely actionable. Nor does the absence of an alert prove the absence of a problem.
To assess a future integration, data access, costs and the scope of sources will need to be clarified. The press release provides no independent measure of accuracy or of generalisable time savings. These points remain to be verified on the company’s own data.
The IT skill to remember: Data Management
This development draws directly on Data Management. Professionals must know where information comes from, check its quality and ensure that transformations preserve the meaning of measures. A convincing explanation can still be misleading if the starting data is incomplete or poorly reconciled.
Their role includes documenting metrics and managing access rights. Users must understand what a KPI measures and what limits frame its interpretation. The details surfaced in an alert must also respect authorised access, particularly when they concern customers or employees.
The work continues in dialogue with business teams. Analysts must be able to verify the observations put forward, spell out uncertainties and track the effect of decisions taken. Automation can speed up investigation; the responsibility for giving results a reliable meaning remains.
Proactive analysis must steer a useful investigation
The value of proactive analysis is measured by its ability to steer a useful investigation. A dashboard that comments on its own changes does not thereby become an autonomous decision-maker: data quality, hypothesis testing and monitoring of results remain decisive.
Further reading
Four CCCLX reads to explore data quality, sharing and use in more depth.
Google Cloud Storage Intelligence Advisor detects storage anomalies
Talk to your database: Oracle improves its NL2SQL AI
Databricks extends Delta Sharing to AI and aims to break down data silos
Merck and Google Cloud commit one billion dollars to agentic AI
Sources
- 01
Salesforce (12 October 2026). “Salesforce Signs Definitive Agreement to Acquire Loops”. Announcement of the acquisition agreement and plans to integrate Loops technology into Tableau.

Europe accuses Anthropic of discrimination after Fable 5 is blocked
A US decision that sparks an international crisis The sudden suspension of access to Anthropic’s Fable 5 and Mythos 5 models outside the United States now goes well beyond technology. What initially looked like a national security measure is taking on a major...

Mobi Fold and Spotlight 2: Logitech aims to simplify everyday hybrid working
The office is everywhere, but the tools do not always keep up Hybrid working has profoundly changed professional habits. Video-conference meetings, frequent travel, days split between home, the office and coworking spaces: employees now move between multiple...
+80%: agentic AI triggers a record surge in enterprise SSD prices
Artificial intelligence is putting new strain on infrastructure Artificial intelligence is often associated with graphics processors and massive computing centres. Yet another essential component of digital infrastructure is coming under unprecedented pressure:...
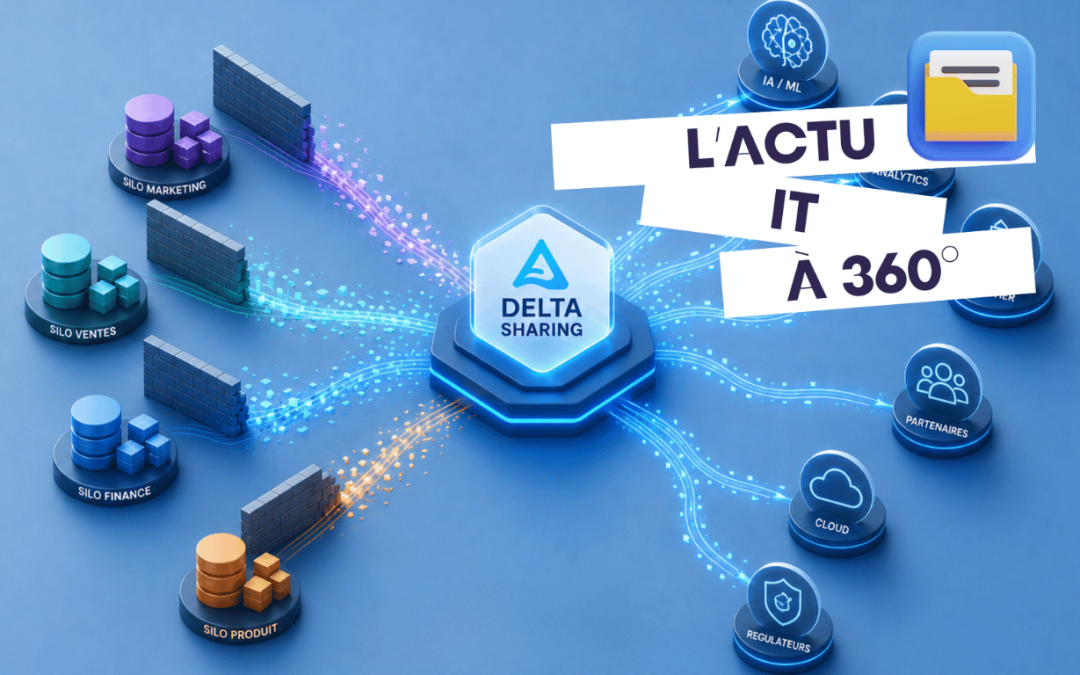
Databricks extends Delta Sharing to AI and aims to break down data silos
Data is no longer enough: intelligence must now be shared too Artificial intelligence is transforming the way companies use their data. Yet one major obstacle remains: the resources needed for AI projects are often scattered across different platforms, teams and...

RTX Spark: Nvidia accelerates the shift to AI-optimised PCs
Nvidia wants to redefine the PC for the age of artificial intelligence Unveiled at Computex 2026, the RTX Spark chip marks a new stage in the evolution of personal computers. With this Arm-based platform, Nvidia is not simply seeking to offer a more powerful...

WiFi 8 is arriving sooner than expected: what it means for businesses
A new generation of networking is already on the horizon While WiFi 7 is only just beginning to spread among businesses and consumers, the industry is already preparing the next step. TP-Link has just unveiled the first WiFi 8-compatible router, confirming that the...

Webedia-Elephant turns to Gemini Enterprise to industrialise generative AI
IT outages become a board-level issue Long regarded as mere technical incidents, service outages are now taking on a whole new dimension. According to a study by Oxford Economics for Splunk, Global 2000 companies suffer an average of 60 downtime incidents a year, at...

$600 billion lost: IT outages take on a new dimension
IT outages are becoming a boardroom issue Long regarded as mere technical incidents, service interruptions are now taking on a whole new dimension. According to a study conducted by Oxford Economics for Splunk, Global 2000 companies suffer an average of 60 downtime...

Lightwell: IBM and Red Hat tackle the open source patching headache
AI finds flaws faster than companies can fix them Artificial intelligence is profoundly transforming cybersecurity. While it makes it possible to detect vulnerabilities more quickly, it also creates a new challenge: the ability to fix a growing number of flaws within...

AWS strengthens OpenSearch to connect AI to enterprise data
AI agents are forcing the cloud to evolve The rise of agentic AI is profoundly transforming cloud infrastructure. Unlike traditional conversational assistants, intelligent agents must access data, interact with several systems and carry out tasks autonomously. To meet...